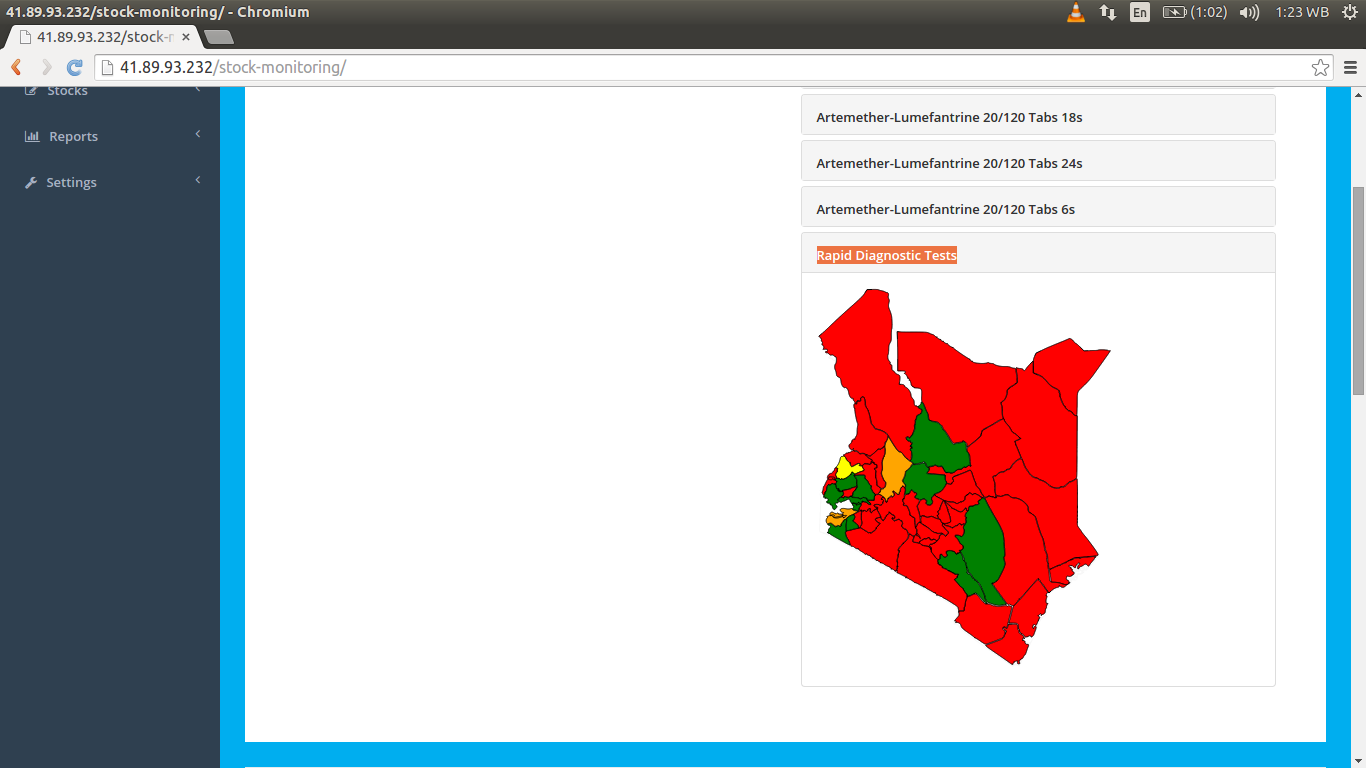
MOS Maps
MOS maps have been used to represent MOS status both at the county and national level.
County Level MOS Report
MOS report is generated of each drug based on the period selected at the county level.
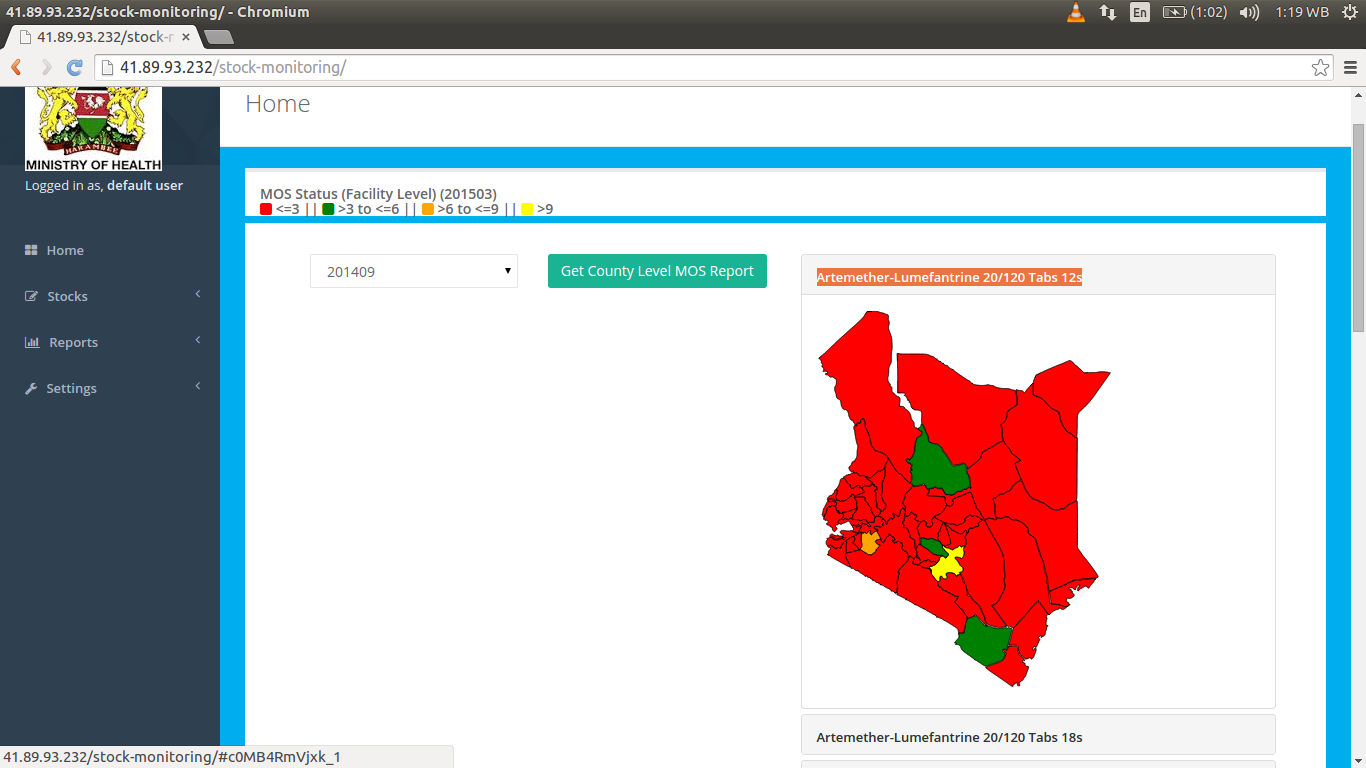
Artemether-Lumefantrine 20/120 Tabs 12s
Here is the screenshot of Artemether-Lumefantrine 20/120 Tabs 12s MOS report:
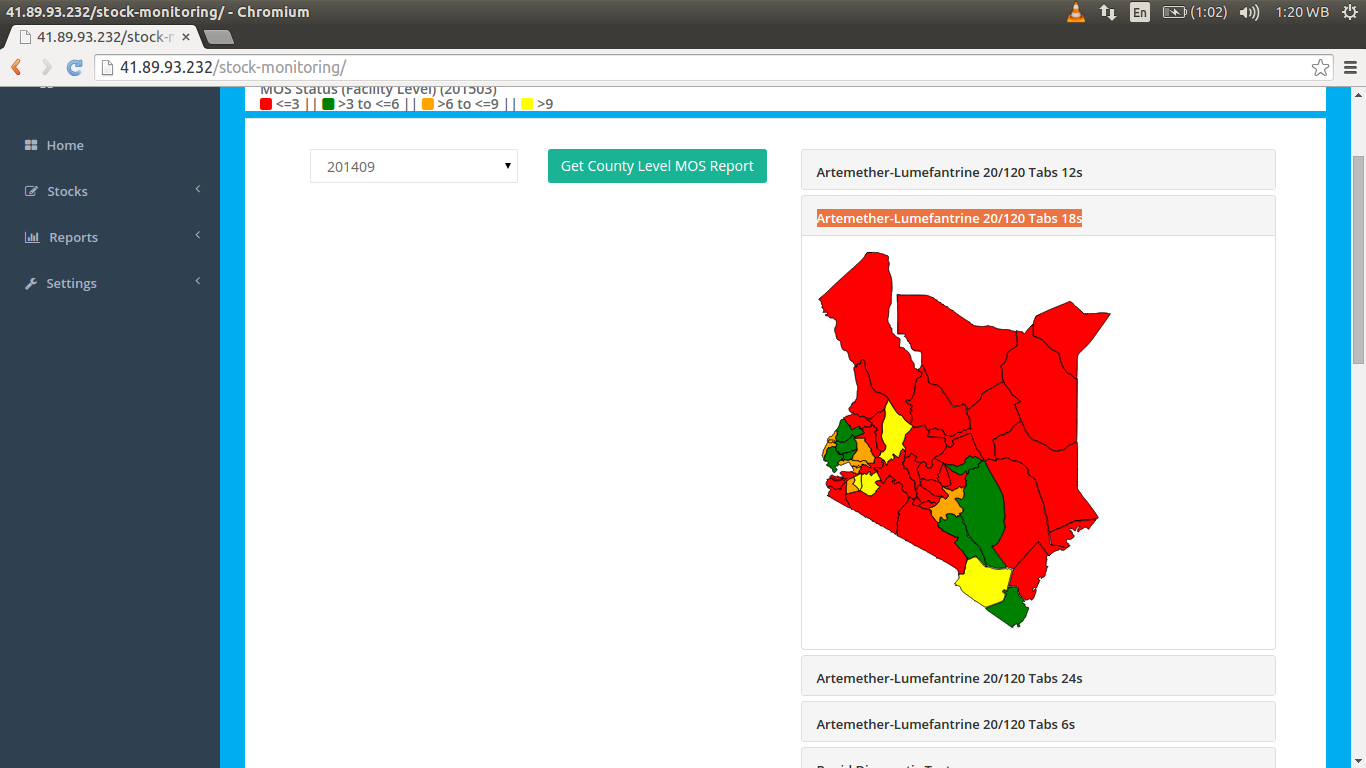
Artemether-Lumefantrine 20/120 Tabs 18s
Here is the screenshot of Artemether-Lumefantrine 20/120 Tabs 18s MOS report:
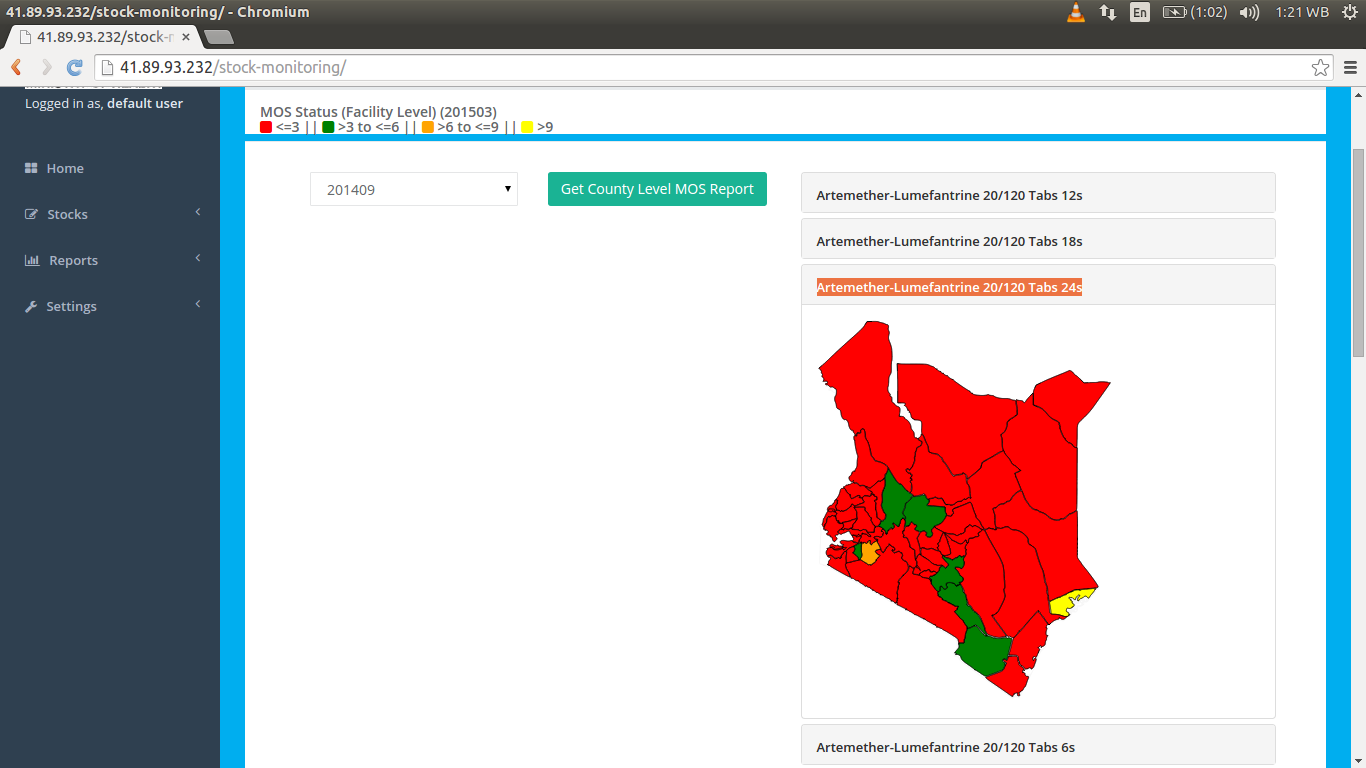
Artemether-Lumefantrine 20/120 Tabs 24s
Here is the screenshot of Artemether-Lumefantrine 20/120 Tabs 24s MOS report:
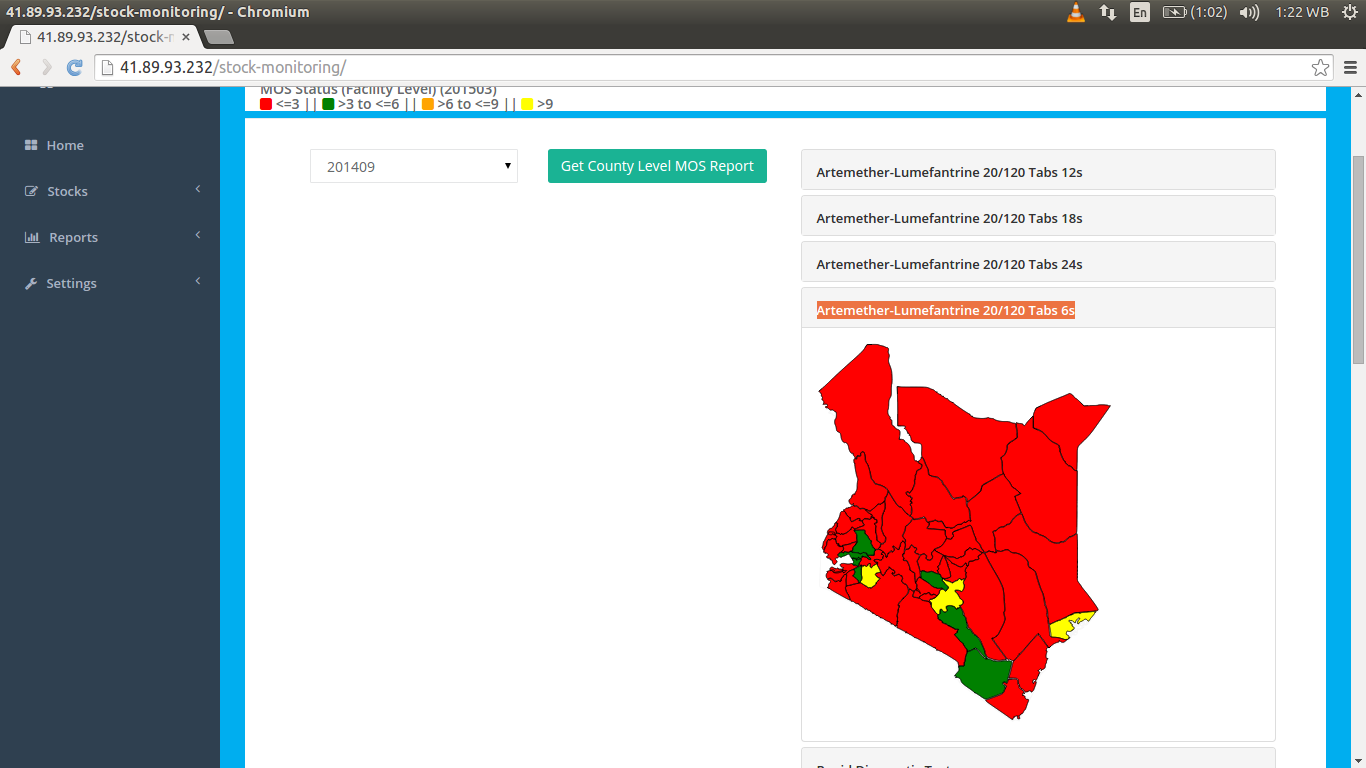
Artemether-Lumefantrine 20/120 Tabs 6s
Here is the screenshot of Artemether-Lumefantrine 20/120 Tabs 6s MOS report:
County level months of stock(MOS) chart
Individual county level months of stock(MOS) Charts are produced here as per the selected period

National Level months of stock(MOS) chart
National level months of Stock (MOS) charts are produced as per the selected period from the drop-down menu.
